Our content is fiercely open source and we never paywall our website. The support of our community makes this possible.
Make a donation of $35 or more and receive The Monitor magazine for one full year and a donation receipt for the full amount of your gift.
Ontario’s unemployment rate dropped in September 2014 to its lowest level since October 2008 – good news or bad?
On the surface, this month’s Statistics Canada numbers could seem like a good news kind of story.
Temporary employment fell.
Part-time employment grew at the same rate as full-time employment.
And, perhaps because of the growth in full-time jobs, even self-employment growth seems to have slowed.
At the same time, it is clear that Ontario’s labour force hasn’t fully recovered from the global economic recession.
Here are a few troubling signs I’m keeping my eye on:
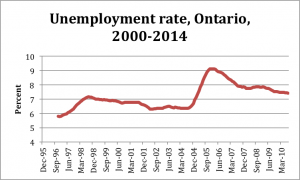
Unemployment gap exists: While, its great to see the unemployment rate coming down, it is important to note that the rate hasn’t reached its pre-recession low yet. The 12-month moving average is still a full percentage point higher than October of 2008.
In terms of unemployment, Ontario still has a long way to go to return to post-recession rates, as the following chart illustrates.

*12-month moving average
Source: Statistics Canada, CANSIM Table 282-0087
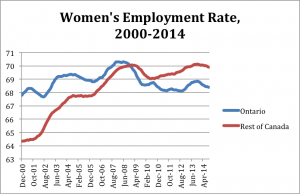
Women’s employment dropping: As with the rest of Canada, women’s employment in Ontario has been steadily falling for the past year. And it is falling faster than in the rest of Canada.
The employment rate of women in Ontario used to push up the Canadian rate, but since the recession, it has actually pushed national employment numbers down. Women’s employment in the rest of Canada has returned to pre-recession levels, but not so in Ontario, where women still have an employment rate one percentage point lower than pre-recession levels.
And that could be particularly important because the employment rate for men in Ontario hasn’t changed much since mid-2011 and is still two percentage points lower than it was before the recession.

*12-month moving average
Source: Author’s calculations with data from Statistics Canada, CANSIM Table 282-0087
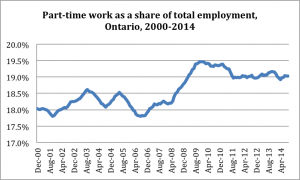
Involuntary part-time workers: Part-time work as a share of total employment in Ontario has increased one percentage point since 2008. During the recession, the part-time employment rate jumped 1.5 percentage points to 19.5% and has held steady at around 19% since 2010.
*12-month moving average
Source: Author’s calculations with data from Statistics Canada, CANSIM Table 282-0087
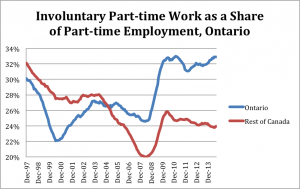
What’s really telling is that the proportion of part-timers in Ontario who would rather be working full-time has increased as well. Involuntary part-time work (or the share of part-time workers who would rather be working full-time) skyrocketed during and after the recession. It showed some signs of abating in 2011 but it has been climbing for the past three years. In Ontario, involuntary part-time work is now a full three percentage points higher than it was when Statistics Canada first started keeping track in 1997. And its on par with the numbers seen in the first two years post-recession.
*12-month moving average
Source: Author’s calculations with data from Statistics Canada, CANSIM Table 282-0013
To make matters more precarious, the gap between the official unemployment rate and the unemployment rate that includes discouraged workers, workers waiting to go back to work, and involuntary part-timers is growing.
Underemployment and discouraged workers: There is more than one way to measure unemployment. The official rate (7.1% as of September) includes only those who are not currently working but have looked for work in the last four weeks. At the same time, we know that there are many discouraged workers out there who would rather be working but have put their job hunt on hold because of a frustration with the lack of decent opportunities in the job market. A second group that could be counted in the unemployment rate is the underemployed: people who would rather be working more hours or are overqualified for their current positions.
Adding these two groups into the measure of unemployment significantly increases Ontario’s unemployment rate. Back in 2000, the increase was just over two percentage points. Today, the increase (or the gap between the two numbers) is a full three percentage points.
This means that the labour market is actually under-performing for a growing number of people who don’t show up in Ontario’s official measures of labour market health. In other words, recovering Ontario’s labour market health continues to be a struggle.
Kaylie Tiessen is economist with the Ontario Office of the Canadian Centre for Policy Alternatives (CCPA Ontario). Follow her on Twitter @KaylieTiessen


