Fast facts:
-
On average, the market income of Canada’s richest one per cent went down a notch, by -0.4 per cent between 2019 and 2020;
-
But if you include income from capital gains, the richest one per cent saw a raise of 3.8 per cent. Stock and real estate gains more than offset the small decrease in market income for the richest;
-
Capital gains make up a quarter of the top one per cent’s income and should be included in inequality measures;
-
The bottom 50 per cent of tax filers saw their market income drop by 14 per cent over that same period, due to the substantial job losses, most heavily among minimum wage workers;
-
Thanks to pandemic income supports, such as the Canada Emergency Response Benefit (CERB), the bottom 50 per cent of tax filers saw a 20 per cent increase in their total income during that time period and the bottom 90 per cent of tax filers—the vast majority of Canadians—saw an 9 per cent increase in income.
Today’s latest income inequality data from Statistics Canada confirms that Canada’s richest experienced the first year of the pandemic (2020) very differently than the bottom 50 per cent of Canadians.
The official Statistics Canada write-up is misleading in that it reports that the top one per cent of Canadians did worse in 2020 than in 2019—their total average market income declined slightly, by 0.4 per cent. You can only come to this conclusion if you completely ignore one of the more important sources of income for the top one per cent: capital gains.
Most Canadians wouldn’t know what capital gains are because they don’t make their income that way. Most Canadians make their money from wages and salaries—which make up most of what Statistics Canada refers to as “market income” (which also includes dividend income, commissions and bonuses). Capital gains are the profits that you make when you sell an asset like stocks, bonds or real estate.
The top one per cent had lower market income in 2020 compared to 2019, but only if you exclude capital gains. Once you include capital gains, it’s clear that Canada’s richest one per cent had an increase in market income in the first year of the pandemic.
What this means is that while the top one per cent saw a decrease in their market income, this was completely offset—and then some—by how much they made in the stock market and the real estate markets, which soared in 2020 and they were uniquely positioned to make money off of.
In 2019, almost a quarter of the top one per cent’s income came from the capital gains on the sale of stocks, bonds and real estate. That huge contribution to their income wasn’t included in the Statistics Canada analysis. The contribution of capital gains to the richest one per cent’s income grew to 27 per cent in 2020, up from 22 per cent in 2019—growth that more than compensated for their relatively small loss in market income.
Source: Statistics Canada table 11-10-0055-01
Anyone following the impact of the pandemic knows that 2020 was a terrible year for workers at the bottom of the income spectrum. The bottom 50 per cent of tax filers saw their market income drop by 14 per cent due to substantial job losses, which were felt most heavily by minimum wage workers. The impact is much less dramatic as you move from the bottom 50 per cent to the bottom 90 per cent. The 40 per cent in the middle, which get included as you move from the bottom 50 per cent to the bottom 90 per cent, did well: their income went up by 0.4 per cent over this time period.
Source: Statistics Canada table 11-10-0055-01
The real hero during the start of the pandemic was Canada’s federal income supports, such as the Canadian Emergency Response Benefit (CERB). If we take a look at total income including capital gains and government transfers (like CERB), Canadians, no matter their income, were better off in 2020, which is incredible given the scale of the job losses in that year.
The bottom 50 per cent of tax filers saw a 20 per cent increase in their total income in the middle of a global pandemic, which is pretty impressive. The bottom 90 per cent of tax filers—the vast majority of Canadians—saw an increase of 9 per cent. And even the top one per cent benefited from federal income supports insofar as their income also rose 3.9 per cent.
If we look at raises in raw dollars, the top one per cent had a raise of $24,600 between 2019 and 2020—10 per cent more than the total income of the bottom 50 per cent in 2020, which was $22,400.
Source: Statistics Canada table 11-10-0055-01
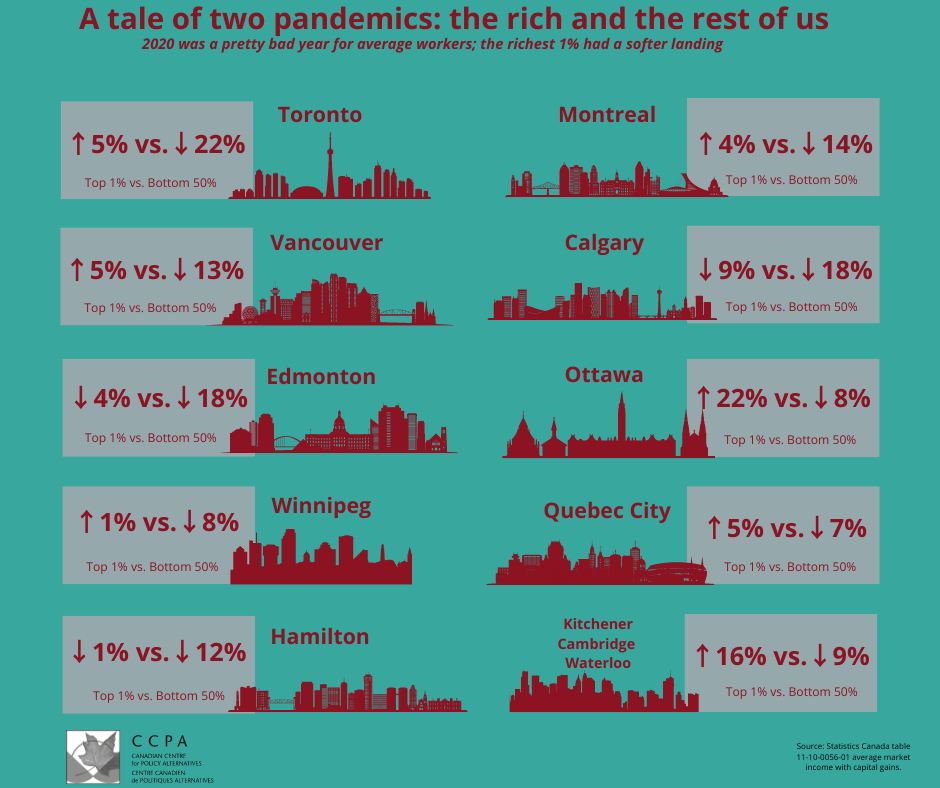
Looking at this data by city generally shows a similar trend: the majority of the top one per cent of a city’s population got a raise (although not always) in 2020. The bottom 50 per cent saw their market income decline in all of Canada’s biggest cities.
Here are the top 10 cities by population. Even when the top one per cent of a city didn’t see a raise in 2020, the bottom 50 per cent saw a much larger drop in market income (including capital gains).
Canada’s richest one per cent has proven to be resilient through all manner of economic jolts in the 2000s—the latest income data shows the story is no different during this pandemic. The richest Canadians have typically emerged from economic crises stronger than before, and the 2020 economic crisis was no exception to that rule.
One of the important ways that this crisis was different, however, was the level of income supports for average workers. There was no equivalent to CERB in the aftermath of the Great Recession in 2008, no student debt repayment freezes after the dot-com crash in 2000. Those supports allowed the 2020 economic crash to turn around very quickly compared to previous crises.
But despite early-pandemic rhetoric around how “we’re all in this together,” the data from 2020 shows that the pandemic’s economic crisis affected Canadians very differently depending on their income level. The lower the income, the harder the hit—and conversely, the higher the income, the softer the landing.
As a new recession looms, it’s time for policymakers to ask themselves whether the lowest-income earners in Canada should continue to bear the brunt of economic downturns.


