Our content is fiercely open source and we never paywall our website. The support of our community makes this possible.
Make a donation of $35 or more and receive The Monitor magazine for one full year and a donation receipt for the full amount of your gift.
While much of the conversation on Canada’s new Census income numbers focuses on the sustained nature of income inequality, little attention has been paid to what’s been happening to the richest 1% compared to the rest of us. This is the first time that a Canadian Census includes information about individuals in this elite club.
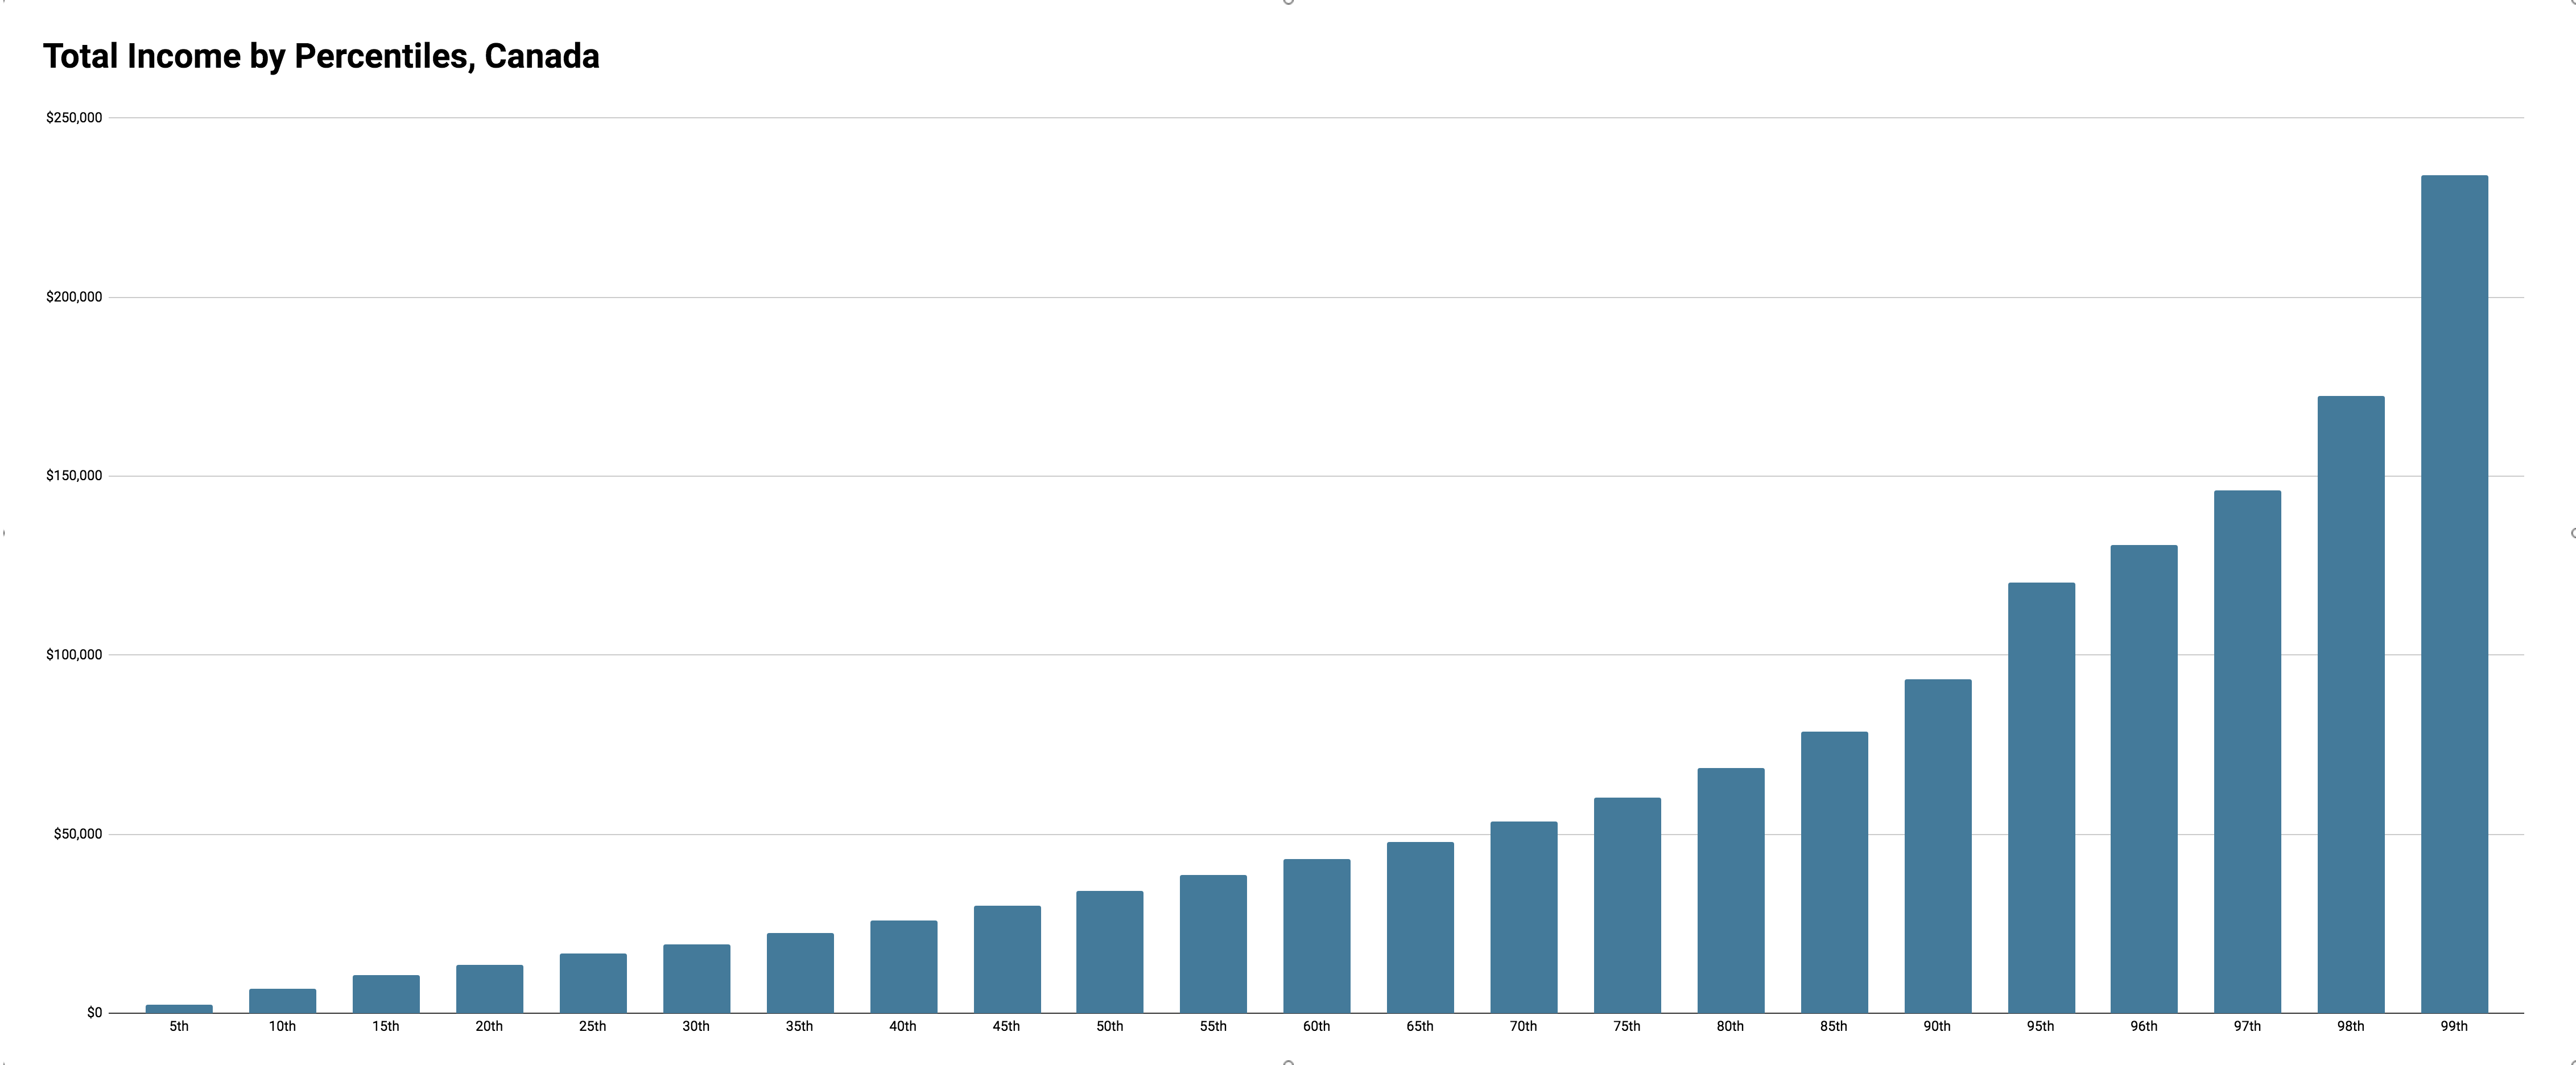
The lucky few individuals who rank among the 1% club reported a median income of $234,130 in 2015. That represents a 14% rise in their median income since 2005 (inflation adjusted).
Much attention has been paid to the fact that median incomes, in general, rose in Canada between 2005 and 2015 but we should also be concerned how much more the richest 1% make compared to workers in the middle of the income spectrum.
The Census data show that the richest 1% now make 6.8 times more than a worker making Canada’s median wage (which was $34,204 in 2015).
This chart breaks down Canadians’ incomes in 2015, from the 5th percentile (which represents some of the poorest Canadians) all the way to the 99th percentile (the richest Canadians).

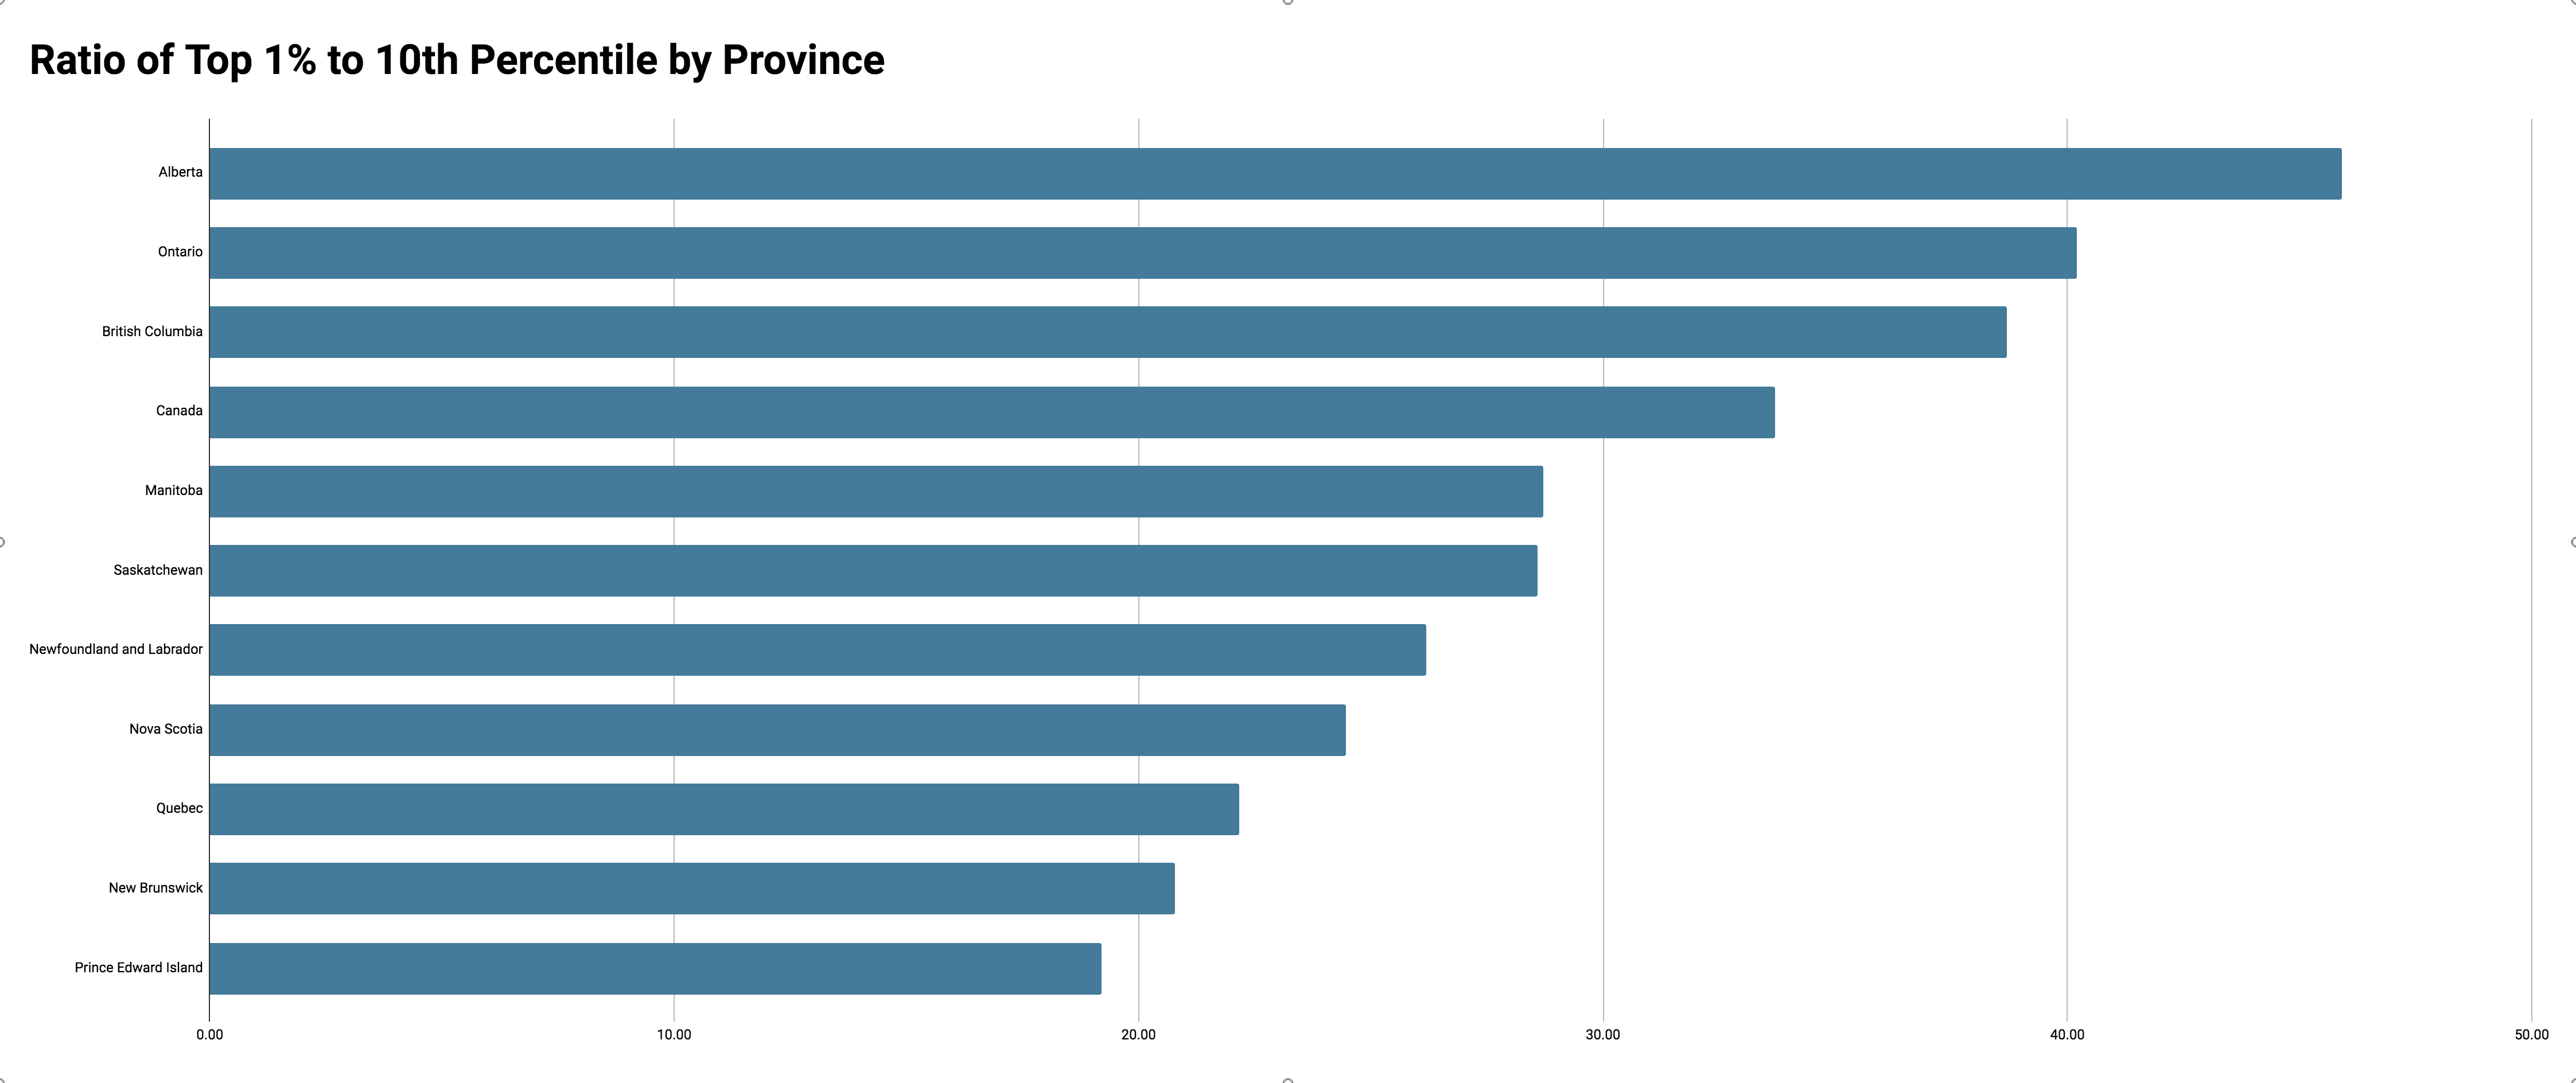
The 1% club, by province Depending on where you live, the gap between the 1% and the rest of us varies.
If you compare incomes of the richest 1% versus Canadians with incomes in the bottom 10% (the 10th percentile), Alberta stands out as having the biggest income gap: Alberta’s richest 1% make 46 times more than the poorest 10% in that province.
Alberta, B.C., and Ontario have the biggest income gaps between the richest 1% and the poorest 10%, while P.E.I. holds the distinction have having the smallest gap.

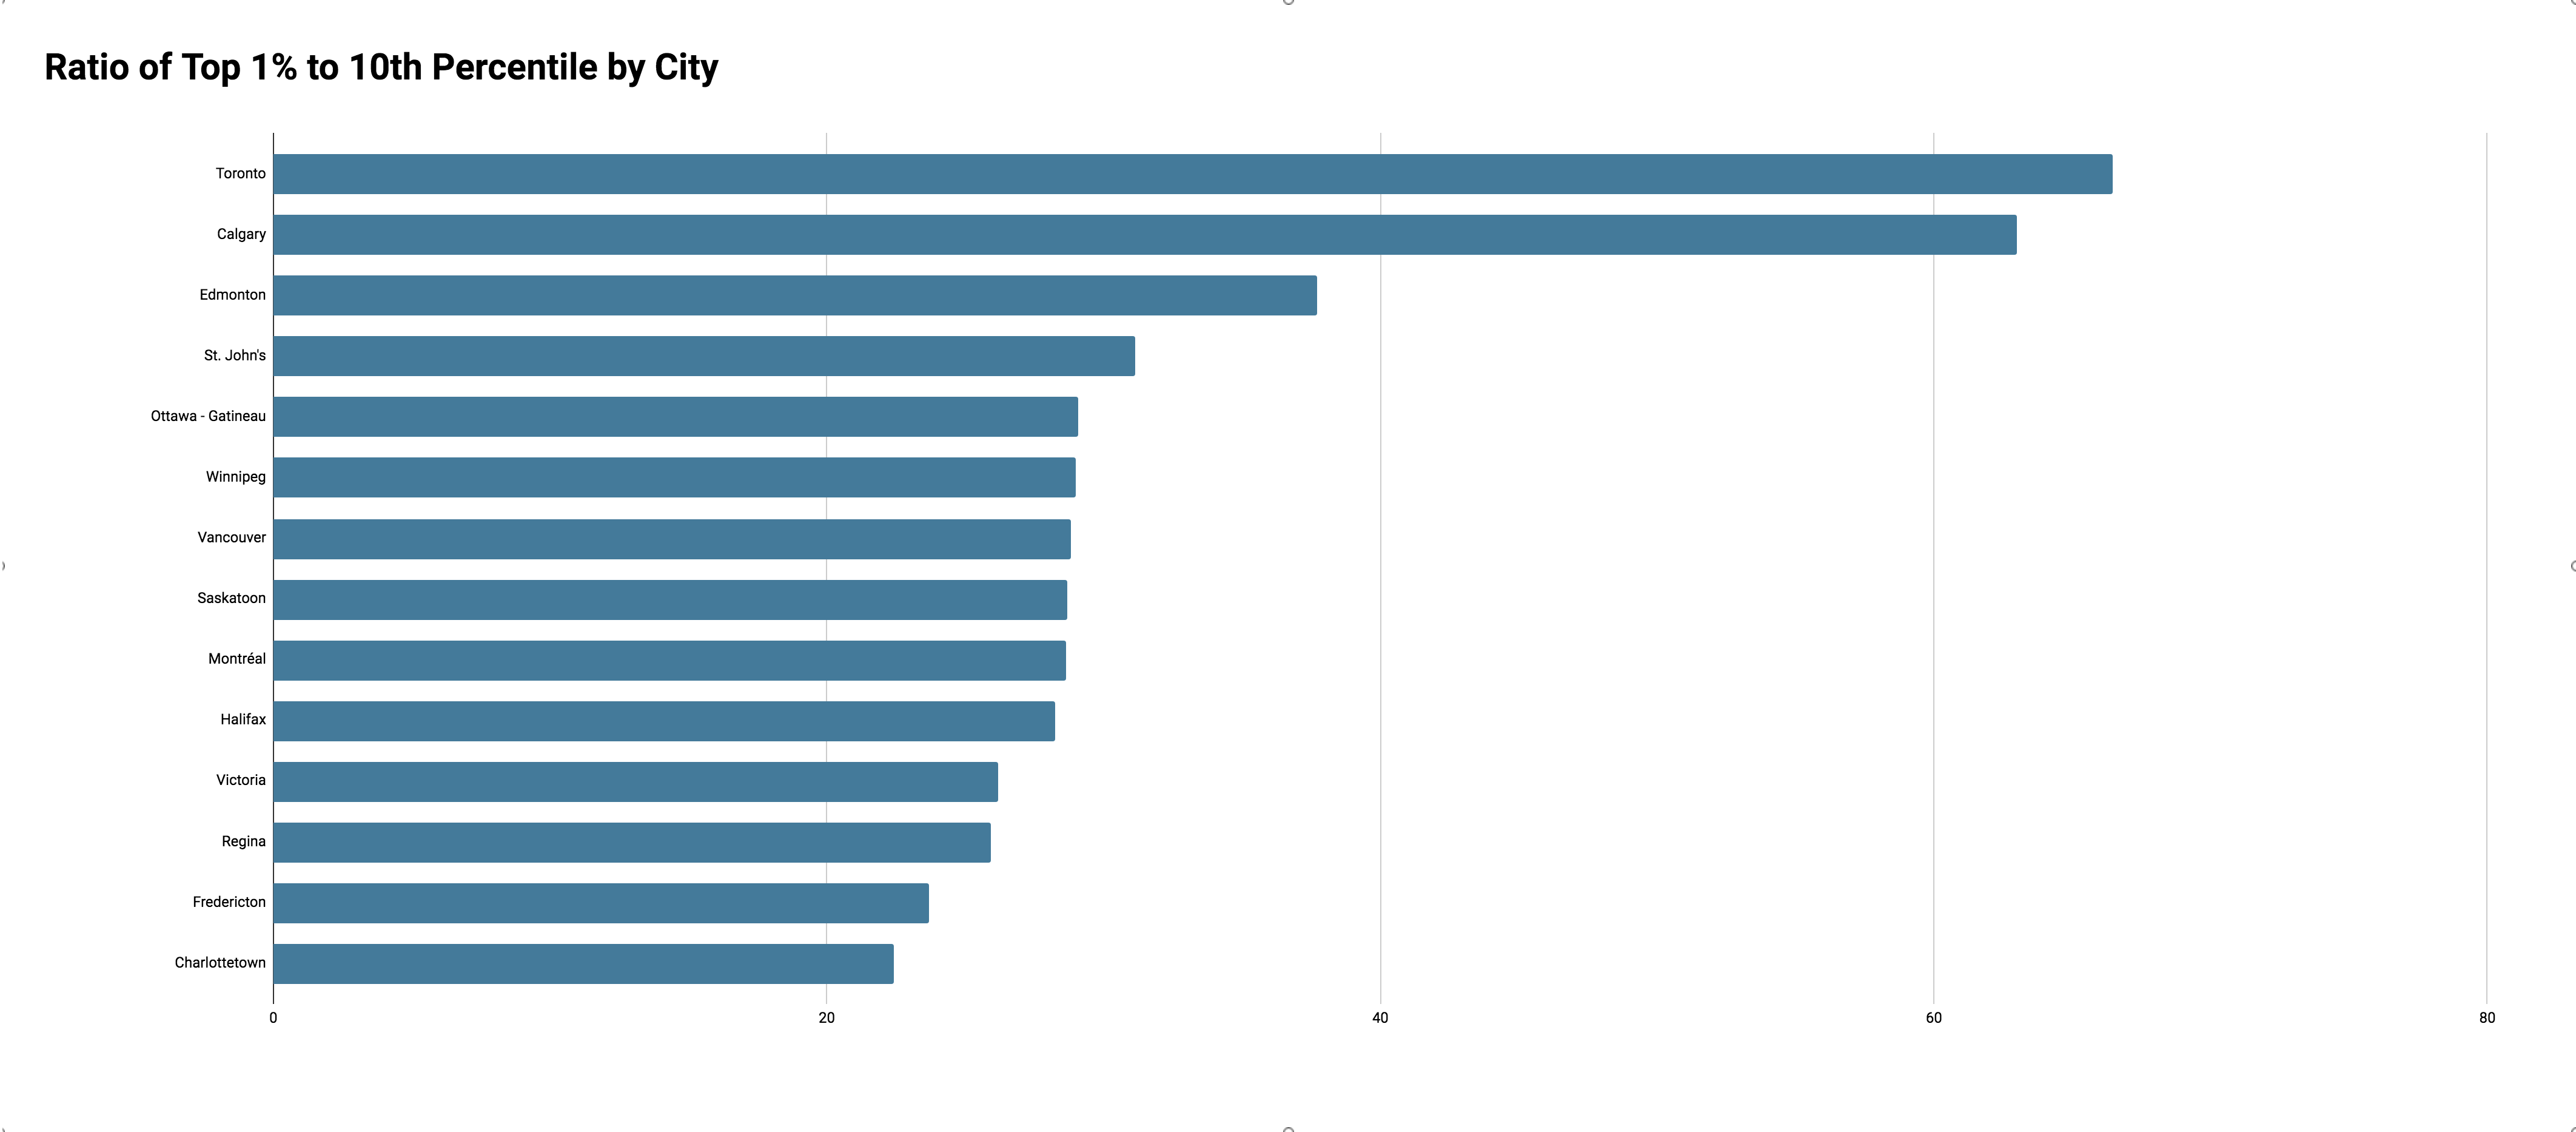
The 1% club, by city The Census data clearly show that income inequality is very much an urban issue.
The gap between the richest 1% and those in the poorest 10% is worse at the city level than it is provincially or nationally.
The gap is biggest in Toronto, where the richest 1% made 66 times more than the poorest 10%. Calgary comes in with the second biggest gap: the richest 1% made 62 times those in the poorest 10%.
Even Charlottetown has a higher income gap than the provincial gap, despite have the lowest inequality on this measure both provincially and at the city level.

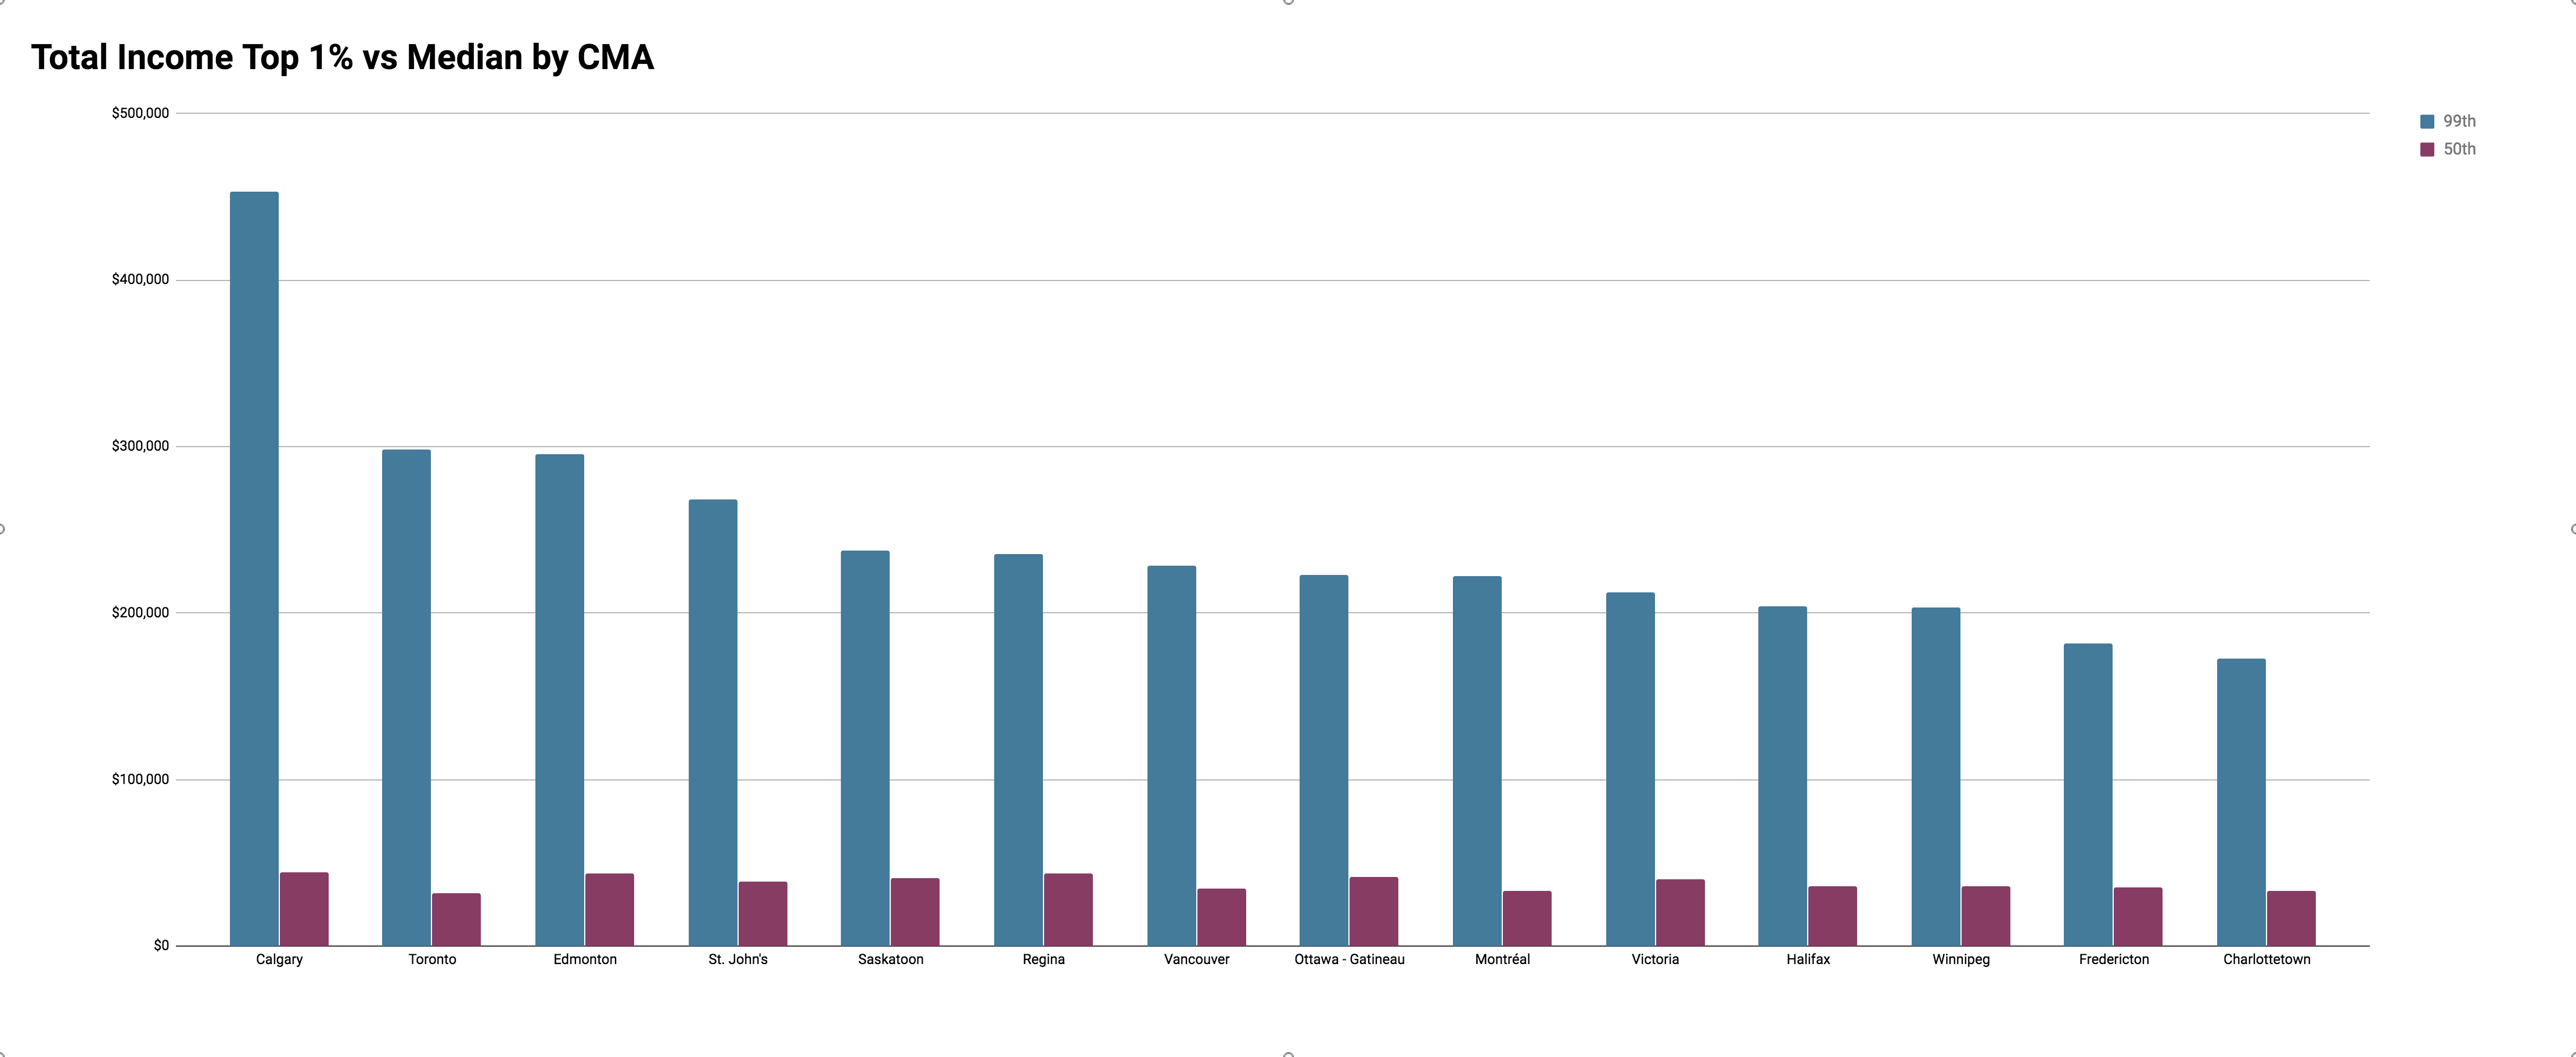
The 1% club vs. the middle class, by city With all the talk about middle class anxiety in Canada, what does the income gap between the richest 1% and Canadians who earn the median income look like at the city level?
For starters, it looks a lot like a resource boom that delivered huge results for the 1% in cities like Calgary, Edmonton, and St. John’s. Expensive cities like Toronto and Vancouver also reflect a big income gap between the 1% and the middle class, as does Montreal.
In Calgary, the 1% made 10.3 times more than the middle in 2015. In Toronto, the 1% made 9.4 times more than the middle. In St. John’s, the 1% made 6.9 times more than the middle. In Edmonton, the 1% made 6.7 times more than the middle. In Montreal, the 1% made 6.7 times more than the middle. In Vancouver, the 1% made 6.6 times more than the middle. In Saskatoon, the 1% made 5.9 times more than the middle. In Winnipeg, the 1% made 5.7 times more than the middle. In Regina, the 1% made 5.4 times more than the middle. In Ottawa, the 1% made 5.4 times more than the middle. In Fredericton and Charlottetown, the 1% made 5.2 times more than the middle.

It seems the sky’s the limit for Canada’s 1% as the gap between them and the rest of Canadian families continues to grow.
Sheila Block is a senior economist with the Canadian Centre for Policy Alternatives. Follow Sheila on Twitter: @SheilaBlockTO


