Our content is fiercely open source and we never paywall our website. The support of our community makes this possible.
Make a donation of $35 or more and receive The Monitor magazine for one full year and a donation receipt for the full amount of your gift.
The release of Statistics Canada’s monthly labour force report is always keenly awaited by economists and policy-makers as a key indicator of Canada’s economic direction. But this month’s release will naturally attract more attention than normal, as it is the last jobs report before the federal election.
This latest report, based on the Labour Force Survey (LFS) conducted in September, showed a strong increase in employment (up 54,000 from the previous month), an even stronger increase in full-time jobs (up 70,000), a 0.2 point decline in the unemployment rate (to 5.5%), and an acceleration in hourly wage growth (up 4.3% over year earlier levels).
Despite that positive news, not too much significance should be ascribed to swings in the monthly jobs numbers: LFS data are notoriously prone to significant month-to-month volatility, which does not necessarily indicate a reliable trend. However, this final pre-election release does provide a convenient opportunity to review Canada’s longer-term labour market performance under respective federal governments. This report disaggregates the full Statistics Canada labour force series (going back to 1976) to compare how Canada’s labour market has fared under the current federal government, in comparison to those that held office previously during the 43-year covered by the Statistics Canada database.
By several indicators, Canada’s labour market has strengthened considerably in the four years since the last federal election. This positive outcome reflects many factors, and cannot be ascribed solely to the actions of the federal government (which has an important but limited impact on Canada’s economy). Nevertheless, having been achieved in the face of several significant economic headwinds (including international trade tensions and uncertainty, and fluctuations in world prices for Canadian commodities), this labour market improvement is a notable and positive development.
Methodology:
Statistics Canada’s LFS provides a consistent and comprehensive monthly database on labour market outcomes dating back to January 1976. (Earlier data are also available, but incorporate different definitions and methodologies, and hence are not strictly comparable.) This report analyses the evolution of several core labour market variables, through eight consecutive Prime Ministerial terms in office, as defined in the table below.
| Prime Ministerial Terms | ||
| PM | Came to Power | Months in Office |
| P.Trudeau 1 | (Jan.76)¹ | (40)¹ |
| Clark | May 79 | 9 |
| P.Trudeau 2 | Feb 80 | 55 |
| Mulroney | Sept 84 | 109 |
| Chrétien | Oct 93 | 122 |
| Martin | Dec 03 | 25 |
| Harper | Jan 06 | 117 |
| J.Trudeau | Oct 15 | 47² |
| ¹ Calculations begin with earliest Statistics Canada Labour Force Survey data in January 1976. ² To September 2019 (most recent LFS data). | ||
Seven different Prime Ministers were elected to office during this period (Pierre Elliot Trudeau had two distinct terms, interrupted by the short tenure of Joe Clark in 1979-80). We exclude the two very short terms in office of John Turner and Kim Campbell: both of whom became Prime Minister solely via internal leadership convention (and were defeated in subsequent federal elections), and neither of whom served in office long enough to meaningfully impact economic policy or conditions. (In our comparisons, their tenures have been appended to those of the elected Prime Ministers they replaced: Pierre Trudeau and Brian Mulroney, respectively.) Since the LFS data began partway through Pierre Trudeau’s 1974-1979 term as Prime Minister, only the latter part of that period is captured in the following comparisons.
Our analysis considers five key indicators reported by the monthly LFS:
- Growth in total employment.
- Unemployment rate.
- Share of part-time jobs in job-creation.
- Employment rate.
- Participation rate.
In every case data are considered for the entire working age population—defined by Statistics Canada to include all Canadians 15 and over. For the unemployment rate, data are also provided for the youth labour market (comprising Canadians aged 15 to 24), which is often considered separately due to the particular challenges faced by young workers. Our comparisons use seasonally adjusted data (to control for the seasonal timing of respective changes in government). Average annual growth rates (for employment), and cumulative changes (for part-time employment, the employment rate, and the participation rate), are calculated by comparing the first and last months of each Prime Minister’s time in office. Average levels (for unemployment rates) are computed over the entire period of each Prime Minister’s tenure (including the first and last months).
Job Creation:
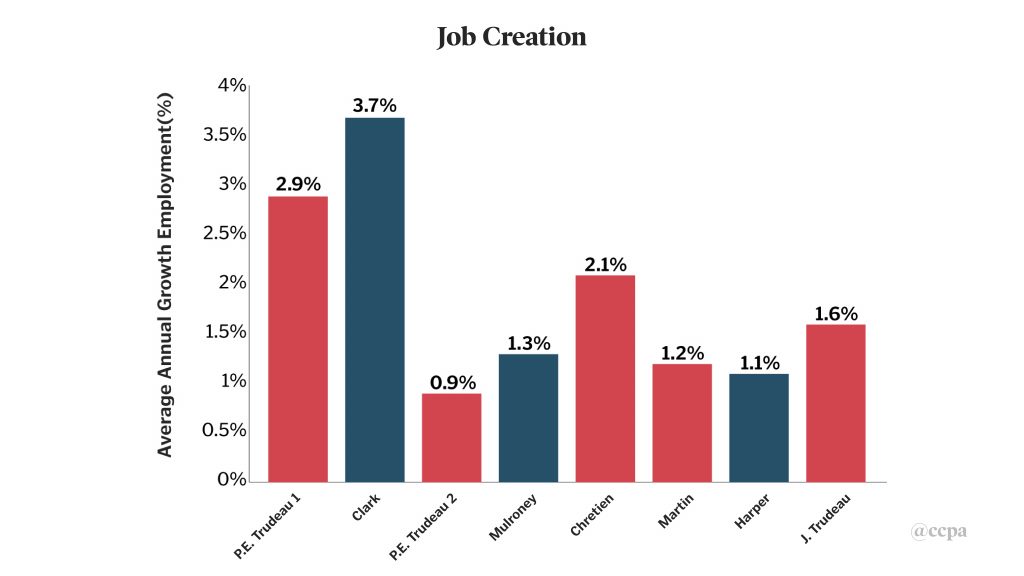
Total employment grew at an average annual rate of 1.6% during the current government’s term. That’s significantly faster than growth under either the Harper or Martin governments, but slower than under the Chrétien government. Full-time employment increased slightly faster than total employment since October 2015: recording an average annual increase of 1.65% per year, two-thirds faster than under the previous government.
Unemployment Rate:
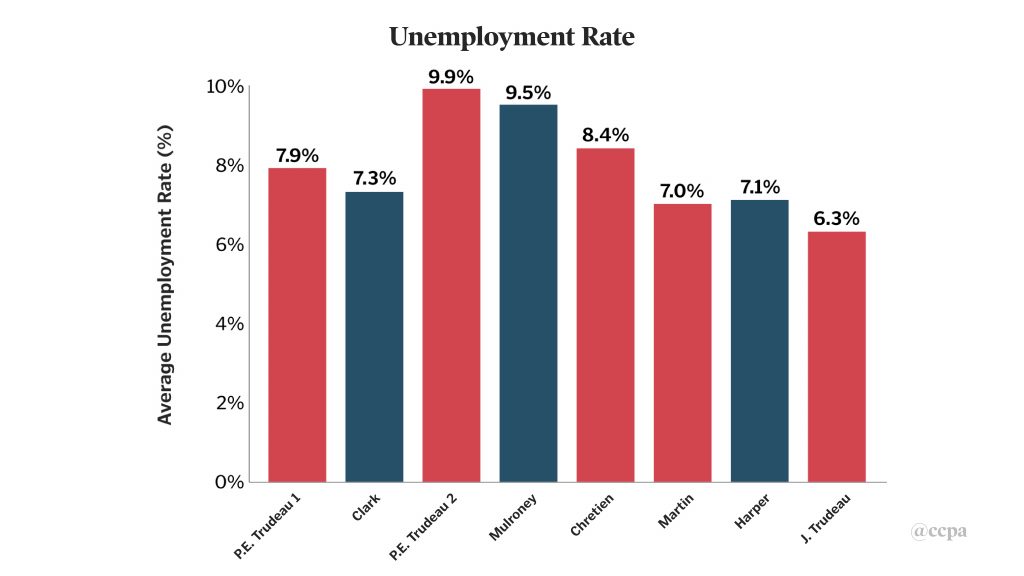
The unemployment rate averaged 6.3% during the current government’s term in office. That’s lower than any of the governments since the 1970s, and an improvement of 0.8 percentage point compared to the Harper government. By mid-2019, the unemployment rate declined to its lowest point in the history of the LFS data.
Youth Unemployment Rate:
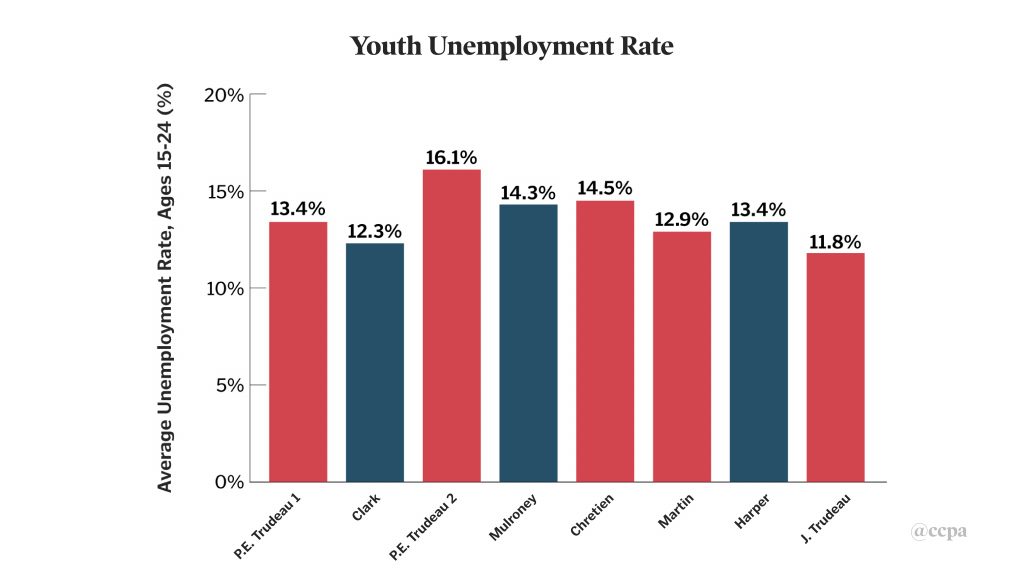
The decline in the average unemployment rate for young people (aged 15-24) under the current government was larger than the overall decline in unemployment: the youth rate fell by 1.6 percentage points, compared to the average under the Harper government. It has averaged 11.8% since October 2015—also the lowest rate of any government since the 1970s.
Part-Time Work:
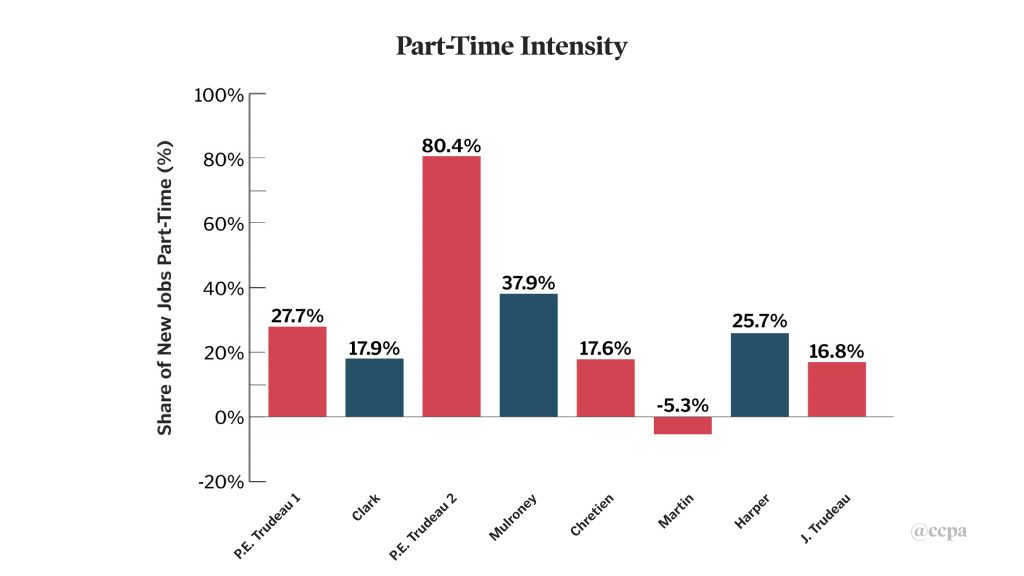
83% of the net new jobs created under the Justin Trudeau government have been full-time; just one-sixth were part-time jobs. That compares favourably to the Harper government, for which over one-quarter of all new jobs created were part-time. Reduced reliance on new part-time jobs resulted in a leveling off of the part-time share of total employment. The part-time share had been increasing fairly steadily for several decades, but has remained stable at just under 19% of employment under the current government.
Employment Rate:
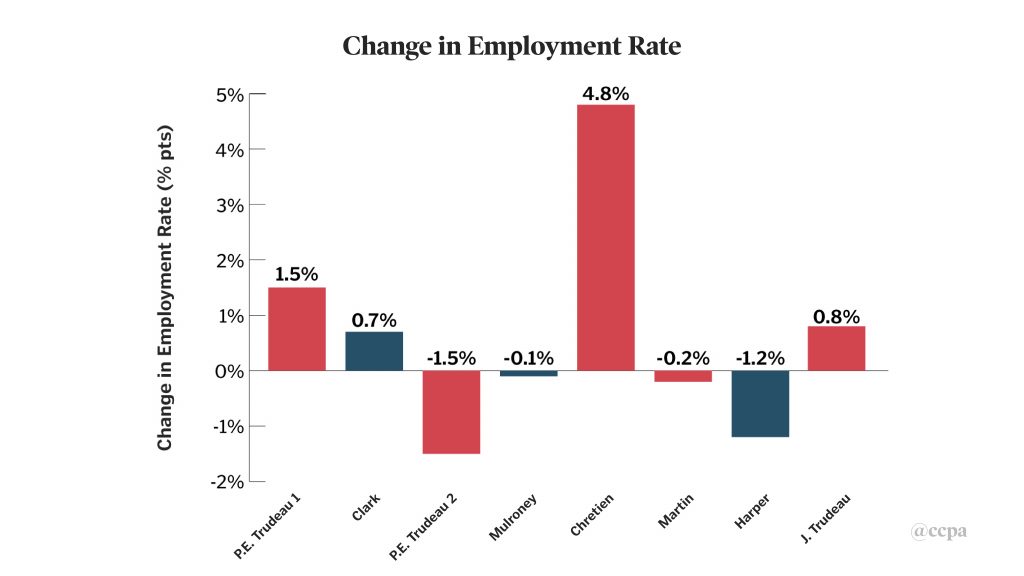
The employment rate can be a more accurate indicator of labour market conditions than the unemployment rate. This is because jobless people may give up looking for work (or may not even start looking) when they don’t think jobs are available. They then disappear from labour market statistics (since they are considered “inactive”), which artificially reduces the official unemployment rate. The employment rate increased decently during the current government’s term, by 0.8 percentage point. That was in sharp contrast to a substantial decline in the employment rate (of 1.2 percentage points) under Stephen Harper. The biggest improvement in the employment rate of any Prime Minister in this period was recorded during the three Chrétien terms (when the employment rate increased almost 5 percentage points, driven by the long economic recovery after the 1991-92 recession).
Labour Force Participation:
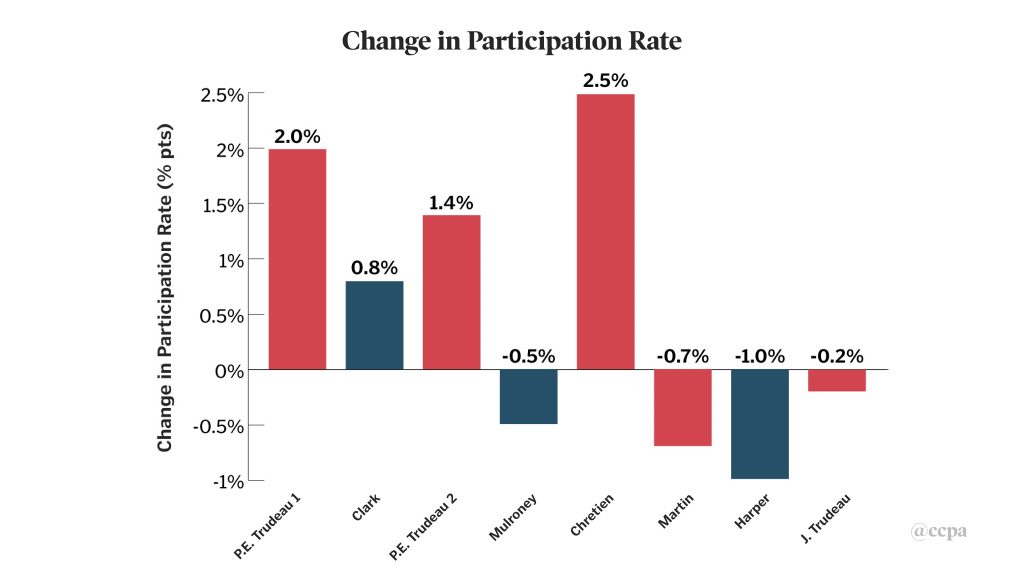
Another sign of job market well-being is a higher rate of labour force participation: that is, the proportion of working-age Canadians who are either working, or actively seeking work. Changes in participation can reflect demographic changes (such as women’s increased paid work or an aging population). Participation also responds to the perceived strength of job opportunities: it typically declines during periods of labour market weakness, and in turn can lead to long-term non-employment and exclusion. After several years of falling participation (including a full percentage-point drop under the Harper government—the worst of any Prime Minister considered), the decline in participation slowed markedly after October 2015. It declined by 0.16 percentage point under the current government. This was despite the underlying downward pressure on participation resulting from continuing ageing of the population—and hence is another indicator of improving labour market opportunities.
Summary and Evaluation:
By the indicators surveyed here, Canada’s labour market has strengthened considerably in the last four years. Job-creation accelerated; the unemployment rate fell to multi-decade lows; the decline in labour force participation slowed; and reliance on part-time work declined slightly. For the first time since the 1990s, a larger share of adult Canadians was employed.
There are many factors, of course, contributing to this improvement in labour market performance under the current government—many of which have little to do with specific federal government policies. After all, in a mostly private-sector economy, government actions have an important but limited impact: driven both by direct government activity (public sector employment, public investment, etc.) and by the indirect impact of government policies (like taxes, spending, trade policies, etc.) on private-sector spending and activity. Given several negative factors affecting Canada’s global economic relations over this period (including deep uncertainty in trade; the application of U.S. tariffs on key Canadian exports; and the decline of world prices for key resources), the post-2015 improvement in labour markets is clearly attributable to domestic conditions. In this regard, the federal government’s willingness to increase program spending (rather than prioritizing deficit reduction), and the impact of its targeted income supports (such as the Canada Child Benefit) on the spending capacity of low-income households, will certainly have contributed to the notable improvement in labour market performance.
The strengthening of Canada’s labour market also provides some context for discussions of “affordability” that have played an important role in this election campaign so far. To be sure, many Canadians face a crisis of affordability, arising particularly from key components of living expenses (such as housing, child care, and prescription drugs) whose costs have increased far faster than overall consumer prices. However, measured by labour incomes, Canadians on average have clearly made progress over the last four years: a larger share of Canadians is working, and at the same time average real wages have increased modestly. Average hourly wages grew at an annual rate of about 2.7% since the last election: about three-quarters of a percentage point faster than average consumer prices; and more recently, hourly wages are growing by over 4% per year. Addressing the continuing and genuine challenges of affordability faced by so many Canadians, will require a multi-pronged approach:
- A future federal government must commit to continuing strong expansion in employment: making job-priority the top macroeconomic priority; bringing the unemployment rate down further—and keeping it there for an extended period to allow workers to win better wages and working conditions.
- Government must also proactively strengthen institutional supports for faster wage growth: a key priority in this regard should include implementing a $15 minimum wage in the federal jurisdiction, as advocated in the CCPA’s Alternative Federal Budget.
- It must also address crucial affordability challenges with targeted policy interventions in high priority areas: such as housing, child care, and prescription drugs. Again, details of how to implement and fund these programs can be found in the Alternative Federal Budget.
The improvement in labour market outcomes since 2015 has obviously not solved all the problems faced by working Canadians and their families. But it has been important in expanding the opportunity to work, and modestly enhancing workers’ bargaining power to win better incomes and conditions. Over the last year, for example, with the unemployment rate at historic lows, the incidence of temporary work declined, average wage growth accelerated, and union density increased. This confirms the importance of expansive macroeconomic policy to both the quantity and quality of jobs. Tightening fiscal and labour policies, to once again prioritize deficit reduction and program spending restraint (rather than job-creation, stronger income supports, and new program spending), would likely lead to a reversal of this progress.
Jim Stanford is Harold Innis Industry Professor of Economics at McMaster University, Director of the Centre for Future Work at the Australia Institute, and a Research Associate of the CCPA.
Editorial note: this post has been updated to correct a typo in the spelling of Joe Clark.


