Our content is fiercely open source and we never paywall our website. The support of our community makes this possible.
Make a donation of $60 or more and receive The Monitor magazine for one full year and a donation receipt for the full amount of your gift.
This week, Behind the Numbers is publishing a series examining Canada’s economic recovery and scrutinizing the government’s economic message. Yesterday we looked at GDP and Economic Growth; today we’re looking at Employment. And Wednesday and Thursday will be looking at indicators of employment quality in the economy.
“Canada now has the best job creation record in the G-7—one million net new jobs since the depths of the recession.” – Speech from the Throne, October 2013
The federal government has used employment growth, or the raw number of new jobs created since the recession, as a proxy for the health of the labour market.
It’s easy to see why this is an attractive statistic for communications—it’s a large number and sounds impressive—but unfortunately, it’s a flawed measure of labour market health.
While Canada’s record in raw job creation is not bad (in our calculations, 2nd in the G-7 and 10th in the OECD), job creation alone is a misleading measure of the overall health of Canada’s job market. The raw number of jobs created in a country is not a useful statistic to measure aggregate labour market health for the simple reason that it doesn’t account for changes in the number of people looking for those jobs. And as noted yesterday, Canada has one of the fastest growing populations in the OECD.
A recent Globe and Mail article put it this way:
“Since the recession, labour-force growth has significantly slowed; the pace has been 1.1 per cent annually, on average, over the past five years. But even that rate implies that we need to add about 17,000 jobs a month just to keep up. … Since employment bottomed in mid-2009, Canada has added more than one million jobs – but at the same time, its labour force has also grown by 800,000 available workers.”
The simple math of Canada’s Labour market is as follows:
During the recession, Canada lost 430,000 jobs and 870,000 new people have entered the labour force since the start of the recession. This means that, in order for the recovery to replace the job losses during the recession and to keep pace with population growth, Canada would have needed to create 1.3 million new jobs during the recovery. However, Canada has only created about 1 million positions since the low-point in nominal employment, a shortfall of 280,000 jobs. By not adjusting for population growth, the statistic used in government-talking points ignores these new workers.
Unemployment in Canada – not yet recovered
Unemployment and employment rates are standard measures of labour market health because, unlike nominal employment, this statistic adjusts for population changes. The unemployment rate is the percentage of people in the labour force, who do not have a job but are actively looking for one.
Recovery in the unemployment rate paints a less rosy picture of Canada’s employment situation.
Canada’s unemployment rate at the end of 2013 Q2 was 7.1%. Ranking only the unemployment rate this places Canada at 3rd in the G-7 and 17th out of the 34 in the OECD member countries.

Source: OECD Short-term Labour Market Statistics Dataset – Harmonised unemployment rate, all ages. Canadian data is Q3 2009 to Q2 2013.
Note: Belgium, France, Greece, Italy, Luxembourg, Netherlands, Slovenia and Spain were at their highest level during the most recent data period and therefore were excluded from recovery analysis.
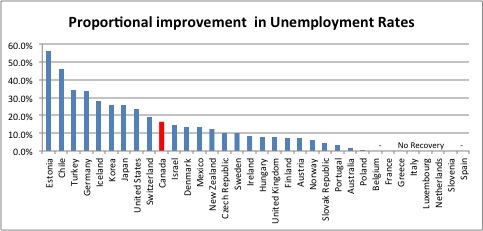
While the current figures for unemployment are interesting for comparison purposes, what is really important is the change over time and, in this case, the proportional improvement over the recession. For instance, Canada’s unemployment rate was 8.5% in Q3 2009 and it fell 1.4 percentage points to 7.1% in Q2 2013. Therefore, there was a proportional improvement was 16%, that is 1.4%/8.5%.

Source: OECD Short-term Labour Market Statistics Dataset – Harmonised unemployment rate, all ages. Trough to 2013 Q2. Trough dates included at the end of the report.
Note: France, Greece, Italy, Luxemboug, Netherlands, Slovenia and Spain have not recovered at all.
Based on the proportional recovery in unemployment, Canada ranks quite poorly in the G-7 coming in 4th place behind Germany, Japan and the United States.

Yet in comparison to the OCED, this proportional decline in Canada’s recessionary unemployment rate appears more modest as 9 of the OECD countries have seen negligible or no recovery in their unemployment rates. Canada ranks 10th out of 34 countries earning a grade of B on our unemployment recovery.
In short, Canada’s unemployment rate is declining but not as fast as other developed countries and in particular not as quickly as other G7 countries. Our unemployment rate currently sits 1.1 percentage points higher than it was in 2008 Q2 before the recession hit Canada. Yet in comparison to the OCED, this proportional decline in Canada’s recessionary unemployment rate appears more modest as 9 of the OECD countries have seen negligible or no recovery in their unemployment rates. Canada ranks 10th out of 34 countries earning a grade of B on our unemployment recovery.

Despite the gains of “a million new jobs”, Canada’s unemployment rate and international comparison on employment isn’t particularly impressive. Job creation has just barely exceeded population growth, and our “recovery” falls 280,000 jobs short of replacing the recessionary job losses – which is why Canada’s unemployment rate remains high.
To learn more about the methodology behind this blog series, click here.
Kayle Hatt is the Canadian Centre for Policy Alternatives’ 2013 Andrew Jackson Progressive Economics Intern.


