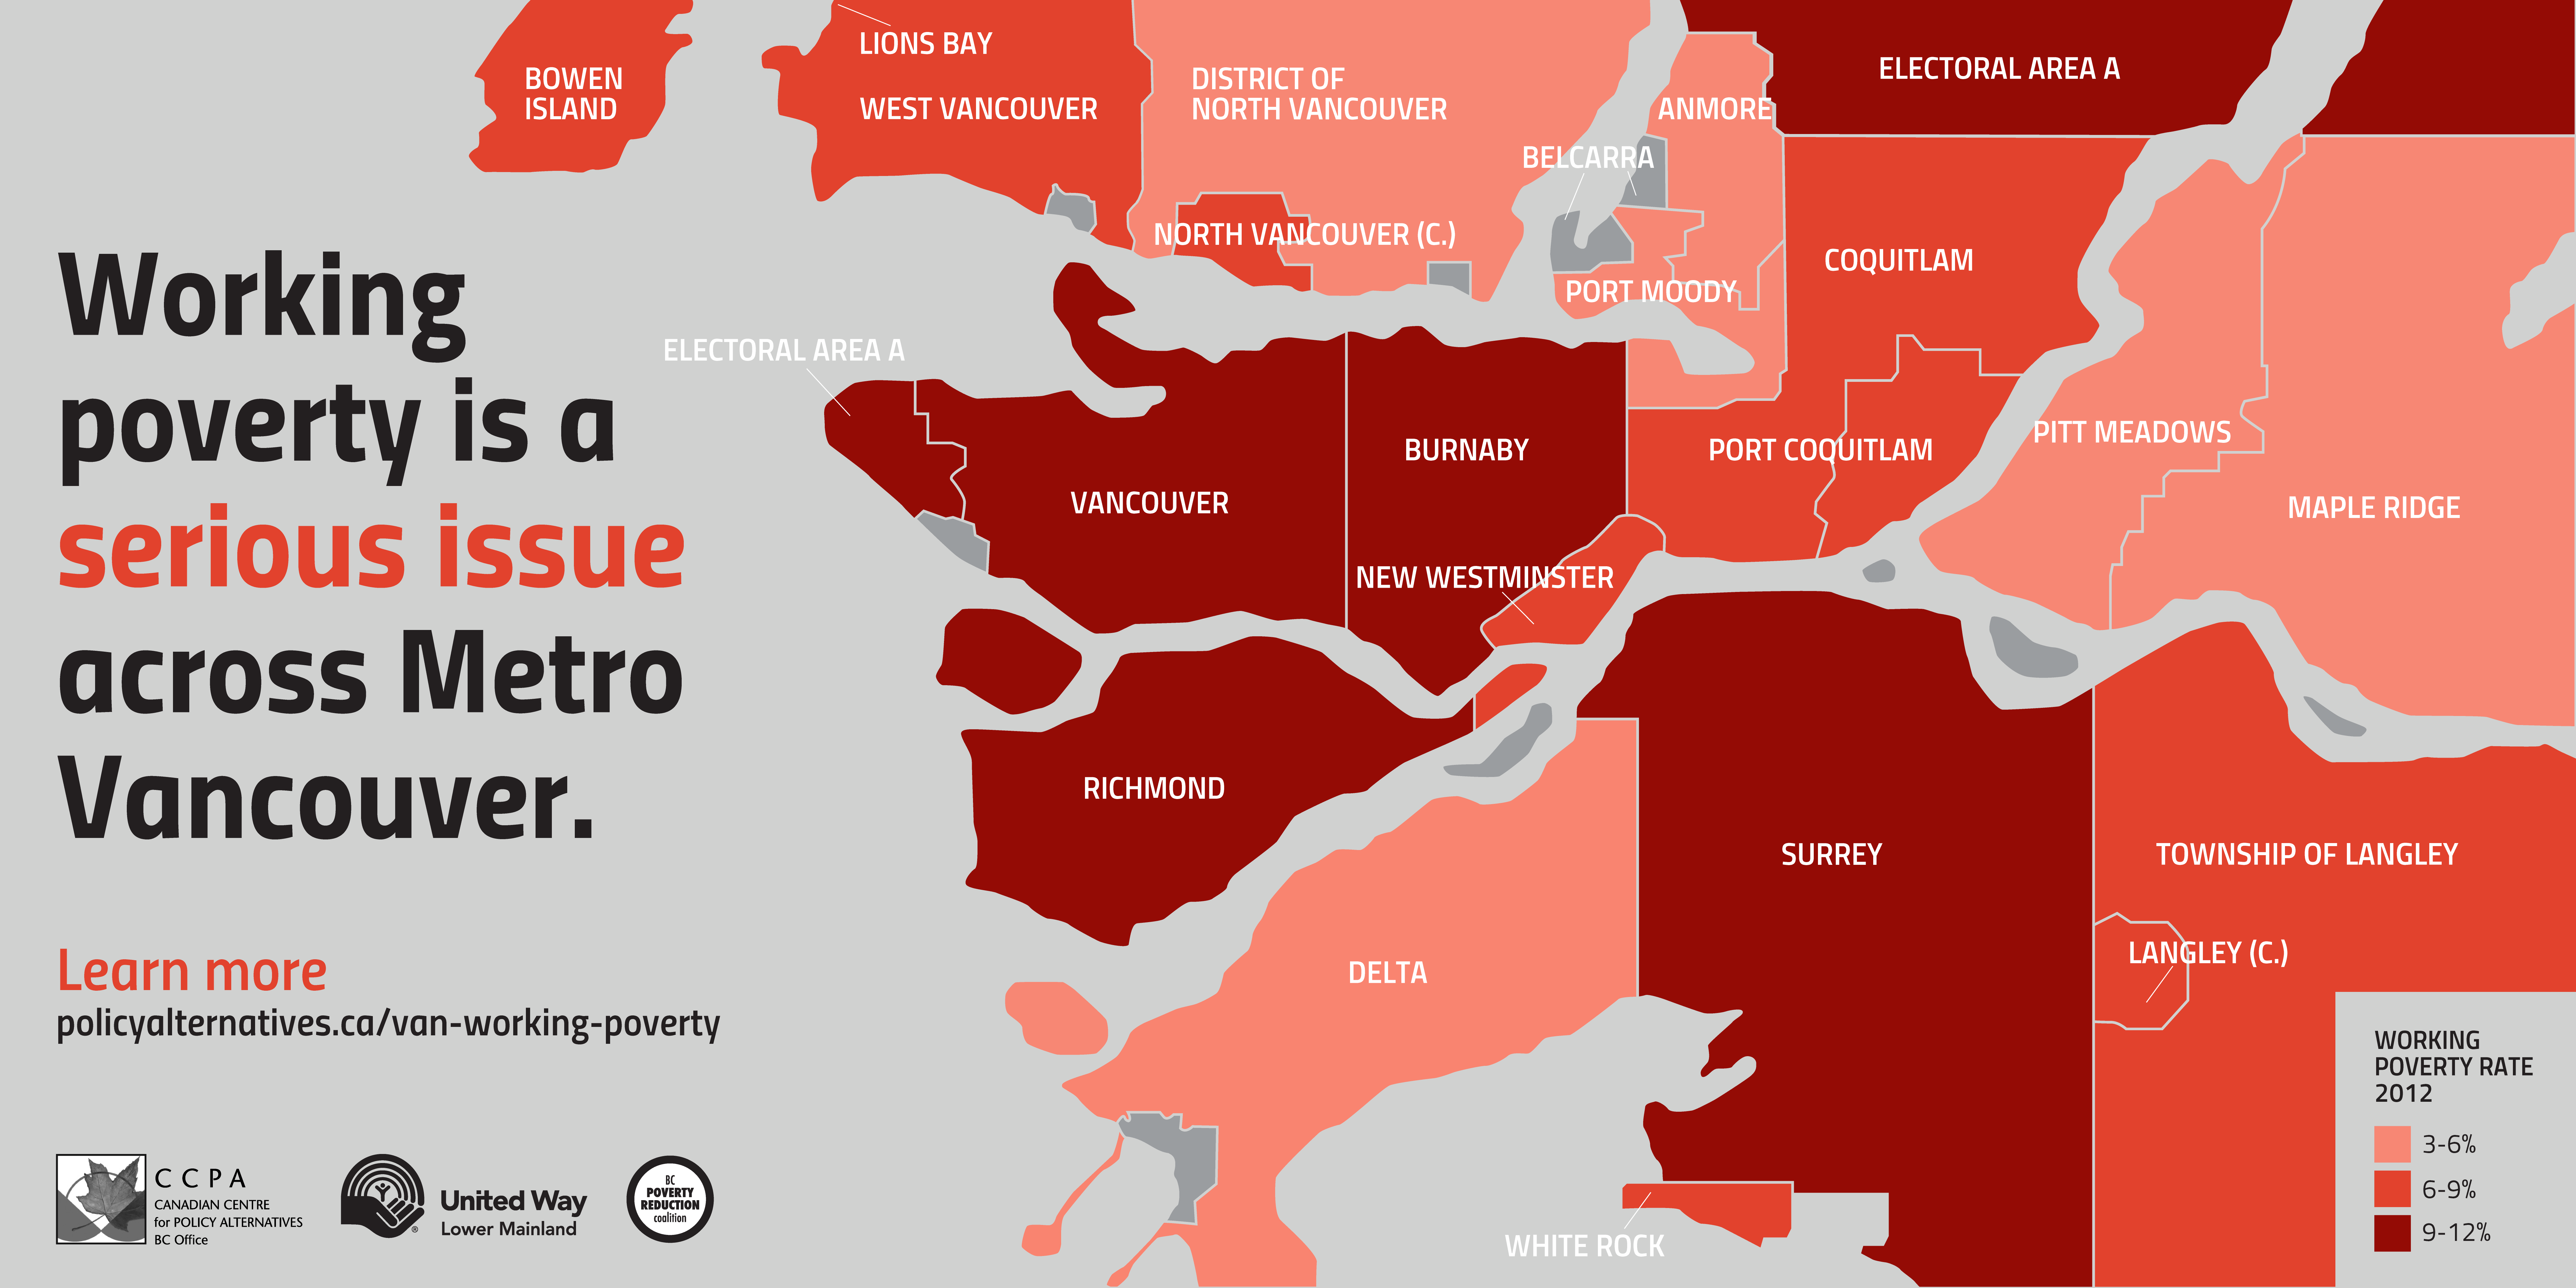
Click to enlarge (files open in a new window). You can also download maps (PDF) via the links below.
Read the news release here.
Attachments
Map 1: Working poverty rate, 2006
Map 2: Working poverty rate, 2012
Map 3: Change in working poverty rate, in percentage points, 2006-2012
Map 4: Percentage change in working poverty rate, 2006-2012


