Our content is fiercely open source and we never paywall our website. The support of our community makes this possible.
Make a donation of $35 or more and receive The Monitor magazine for one full year and a donation receipt for the full amount of your gift.
On Tuesday, the Parliamentary Budget Office released their long awaited costing and distributional analysis of the tax measures implemented since the Harper government has been in power. In essence, they asked what is the cost of these tax cuts, who benefits, and to what degree.
The Price Tag of the Tax Cuts
The total cost of the tax cuts implemented by this government is $30.4 Billion in 2014 ($17.1B on the income tax side and $13.3B from the GST/HST cuts). This is in addition to the cuts to the federal corporate income tax, which the PBO report did not look at but Jim Stanford has estimated to cost around $13 billion in annual revenue.
For comparison, reducing post-secondary tuition fees to 1992 levels (as proposed by this year’s Alternative Federal Budget) would cost $2.8 billion and eliminating all university fees in Canada would cost $5.9 billion a year[i]. Or for less than the tax cuts, we could implement a national pharmacare program and a national affordable childcare program, which would cost $4.5 billion and $6 billion respectively once fully implemented, as proposed by the CCPA.
Although some on the right of the political spectrum might think $43.4 billion in annual tax cuts is something to be celebrated, the end result has been missed opportunities and undermined government capacity.
Additionally, consider the fact these tax cuts were all either implemented or allowed to continue during the period of deficits in recent years – the fact that the government has given away such a large amount in tax cuts while running deficits balances, undermines this governments supposed ‘financial responsibility’ credentials. As CCPA economist Armine Yalnizyan said at the launch of the 2014 AFB: “Canada doesn’t have a deficit problem. Canada has a revenue problem”.
Who really benefits from the tax cuts?
One of the most interesting things about the PBO report is a distributive analysis that determines who benefits from the measures across the income distribution and to what degree.
You may have heard some talking-points or chatter on the twittersphere that these tax cuts mostly benefit ‘low and middle income’ people. The reality is that it depends on how you define “benefits”.
The PBO provided two ways to look at the distributive effect of the tax cuts: as a percentage of after-tax income and in a raw dollar value, by after tax decile.
Looking at the tax cuts by decile compared to average income, people in the 3rd poorest decile received the largest benefit at 4% of their income, with benefits relative to income declining from there. The higher up the income spectrum you go from there, the less benefit of a proportion of income you get.
However, just because lower income households get a higher benefit as a percentage of their income does not mean that most of the benefits go to lower income individuals. This is because 4% of $26,905 (the average after tax income in the 3rd decile) is far less than 2.3% of $122,146 (the average in the 9th decile).
If every household in the country just got the same amount of this $30.4 billion, each household would get $1,939. However, for the tax cuts since 2005, the bottom 50% of Canadian households don’t even get that much – with an average benefit of only $1,130 across the bottom 50%.
On the flipside, those on the top get more than this basic equality. The more astute of you might ask why we’re sending tax breaks to Canada’s richest whose income has gone up substantially anyway due to income inequality. In fact the richest 5% of Canadian households received on average $4,170 in tax breaks, despite this group capturing an ever bigger share of income at the expense of the bottom 90% of Canadians.
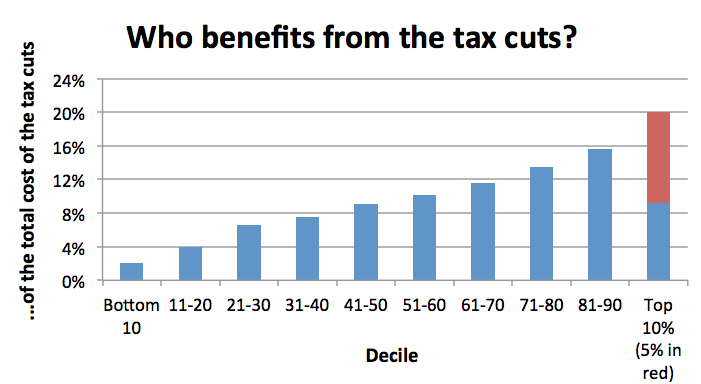
The question everyone should be asking is: of the $30.4 billion dollar price tag for these tax cuts, how much goes to which group of people?

The Answer [ii]:
The top 20%, whose incomes are at least $109,000 per year, receive more than the entire bottom half put together. And nearly half of the total spending on these tax cuts – $14.9 billion – goes to those in the top 3 income deciles.
In short, it would be inaccurate to say that most of the benefits of the Conservatives’ $30.4 billion dollars in tax cuts went to the middle class, as it is now being spun on social media.
Yes, the lower and middle class did slightly better than others relative to their lower levels of income, however in raw terms the greatest beneficiaries were those in the upper income ranges.
Kayle Hatt is a Research Associate with the Canadian Centre for Policy Alternatives’ National Office and was the CCPA’s 2013 Andrew Jackson Progressive Economics Intern.
[i] Based on 2014-15 projected average weighted tuition fees by province from CCPA’s Degrees of Uncertainty report and enrollment by province from CANSIM 477-0019, projected forward at the average 5 year enrolment growth rate.
[ii] Calculated based on the benefits of the GST cut details in PBO Figure 14-2, the summary of personal income tax measures detailed in PBO Figure 2-3, and the costs of the total tax measures detailed in PBO Figure 1-2.


